Model Assessment and KNN Classification
4/6/23
Housekeeping
We will have an implementation assignment this week (most likely begin in class tomorrow)
Still need to hear about project partners!
Model assessment
Model assessment in classification
In the case of binary response, it is common to create a confusion matrix, from which we can obtain the misclassification rate and other rates of interest

FP= “false positive”,FN= “false negative”,TP= “true positive,TN=”true negative- “Success” class is the same as “positive” is the same as “1”
Can calculate the overall error/misclassification rate: the proportion of observations that we misclassified
- Misclassification rate = \(\frac{\text{FP} + \text{FN}}{\text{TP} + \text{FP} + \text{FN} + \text{TN}} = \frac{\text{FP} + \text{FN}}{n}\)
Example
| pred | true |
|---|---|
| 0 | 0 |
| 1 | 1 |
| 0 | 1 |
| 1 | 0 |
| 1 | 1 |
| 1 | 1 |
| 0 | 0 |
| 0 | 0 |
| 1 | 1 |
| 0 | 1 |
10 observations, with true class and predicted class
Make a confusion matrix!
Pred |
True |
|
|---|---|---|
| 0 | 1 | |
| 0 | 3 | 2 |
| 1 | 1 | 4 |
Types of errors
False positive rate (FPR): fraction of negative observations incorrectly classified as positive
Number of failures/negatives in data = \(\text{FP} + \text{TN}\)
\(\text{FPR} = \frac{\text{FP}}{\text{FP} + \text{TN}}\)
False negative rate (FNR): fraction of positive observations incorrectly classified as negative example
Number of success/positives in data = \(\text{FN} + \text{TP}\)
\(\text{FNR} = \frac{\text{FN}}{\text{FN} + \text{TP}}\)
Mite data errors
I fit a logistic regression to predict heart present using predictors Topo and WatrCont, and obtained the following confusion matrix of the train data:
Pred |
True |
|
|---|---|---|
| 0 | 1 | |
| 0 | 16 | 5 |
| 1 | 5 | 44 |
What is the misclassification rate?
- Misclassification rate: (5 + 5)/70 = 0.143
What is the FNR? What is the FPR?
FNR: 5/49 = 0.238
FPR: 5/21 = 0.102
Threshold
Is a false positive or a false negative worse? Depends on the context!
The previous confusion matrix was produced by classifying an observation as present if \(\hat{p}(x)=\widehat{\text{Pr}}(\text{present = 1} | \text{Topo, WatrCont}) \geq 0.5\)
Here, 0.5 is the threshold for assigning an observation to the “present” class
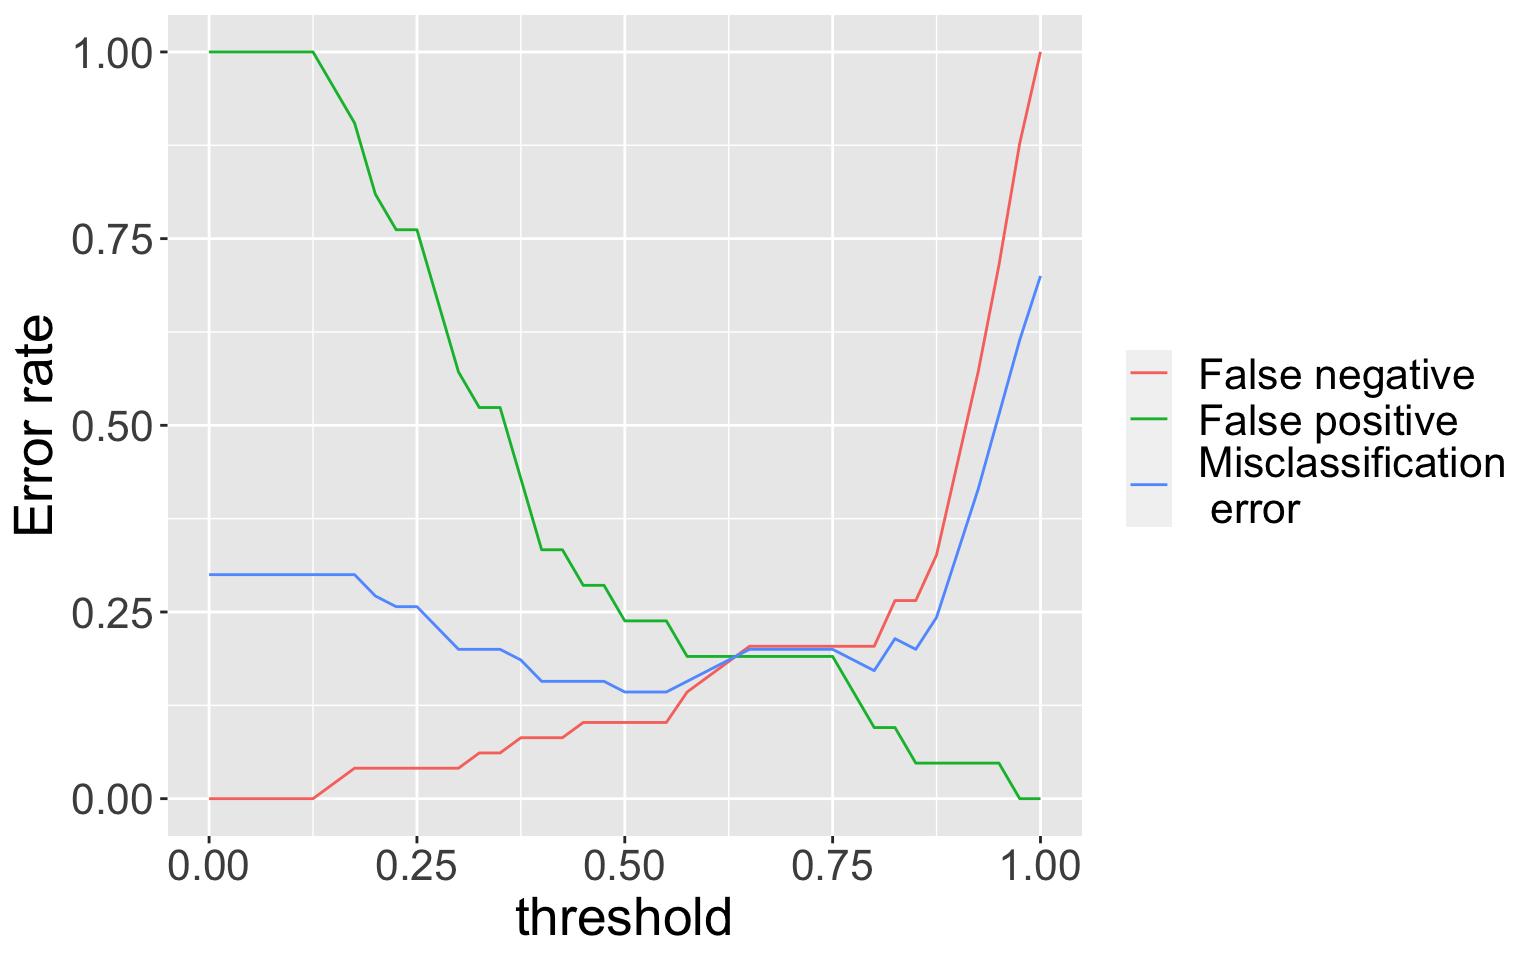
Can change threshold to any value in \([0,1]\), which will affect resulting error rates
Varying threshold

Overall error rate minimized at threshold near 0.50
How to decide a threshold rate? Is there a way to obtain a “threshold-free” version of model performance?
ROC Curve
The ROC curve is a measure of performance for binary classification at various thresholds
- ROC is a probability curve, and the Area under the curve (AUC) tells us how good the model is at distinguishing between/separating the two classes
The ROC curve simultaneously plots the true positive rate TPR on the y-axis against the false positive rate FPR on the x-axis
An excellent model has AUC near 1 (i.e. near perfect separability), whereas a terrible model has AUC near 0 (always predicts the wrong class)
- When AUC = 0.5, the model has no ability to separate classes
ROC Curve (cont.)
ROC and AUC for the training data:

- How do you think we did?
KNN Classification
KNN Classification
While logistic regression is nice (and still frequently used), the basic model only accommodates binary responses. What if we have a response with more than two classes?
We will now see how we can use KNN for classification
- Side note: when people refer to KNN, they almost always refer to KNN classification
Finding the neighbor sets proceeds exactly the same as in KNN regression! The difference lies in how we predict \(\hat{y}\)
Example: mite data
This is a similar plot to that from KNN regression slides, where now points (plotted in standardized predictor space) are colored by
presentstatus instead ofabundance.Two test points, which we’d like to classify using KNN with \(K = 3\)


How would we classify?

Discuss: which class labels would you predict for test points 1 and 2, and why?
- Estimated conditional class probabilities \(\hat{p}_{ij}(\mathbf{x}_{i})\) are obtained via simple “majority vote”:
- \(\hat{p}_{1, \text{present}}(\mathbf{x}_{1}) = \frac{3}{3} = 1\) and \(\hat{p}_{1, \text{absent}}(\mathbf{x}_{1}) = \frac{0}{3} = 0\)
- \(\hat{p}_{2, \text{present}}(\mathbf{x}_{2}) = \frac{1}{3}\) and \(\hat{p}_{2, \text{absent}}(\mathbf{x}_{2}) = \frac{2}{3}\)
Beyond two classes
KNN classification is easily extended to more than two classes!
We still follow the majority vote approach: simply predict the class that has the highest representation in the neighbor set
palmerPenguinsdata: size measurements for adult foraging Adélie, Chinstrap, and Gentoo penguinsWe will classify penguin species by size measurements!
KNN classification: different K


- What class would you predict for the test point when \(K = 9\)?
- What class would you predict for the test point when \(K = 5\)?
Handling ties
An issue we may encounter in KNN classification is a tie
- It is possible that no single class is a majority!
Discuss: how would you handle ties in the neighbor set?